CASTA Cross-Asset State-Space Trading Systemfor Drawdown Control in Stock Markets

——— IEEE ICDM 2026 see you in Shenyang ———

Yu Peng1  ·  Matloob Khushi2  ·  Josiah Poon1

1. The University of Sydney 2. Brunel University London

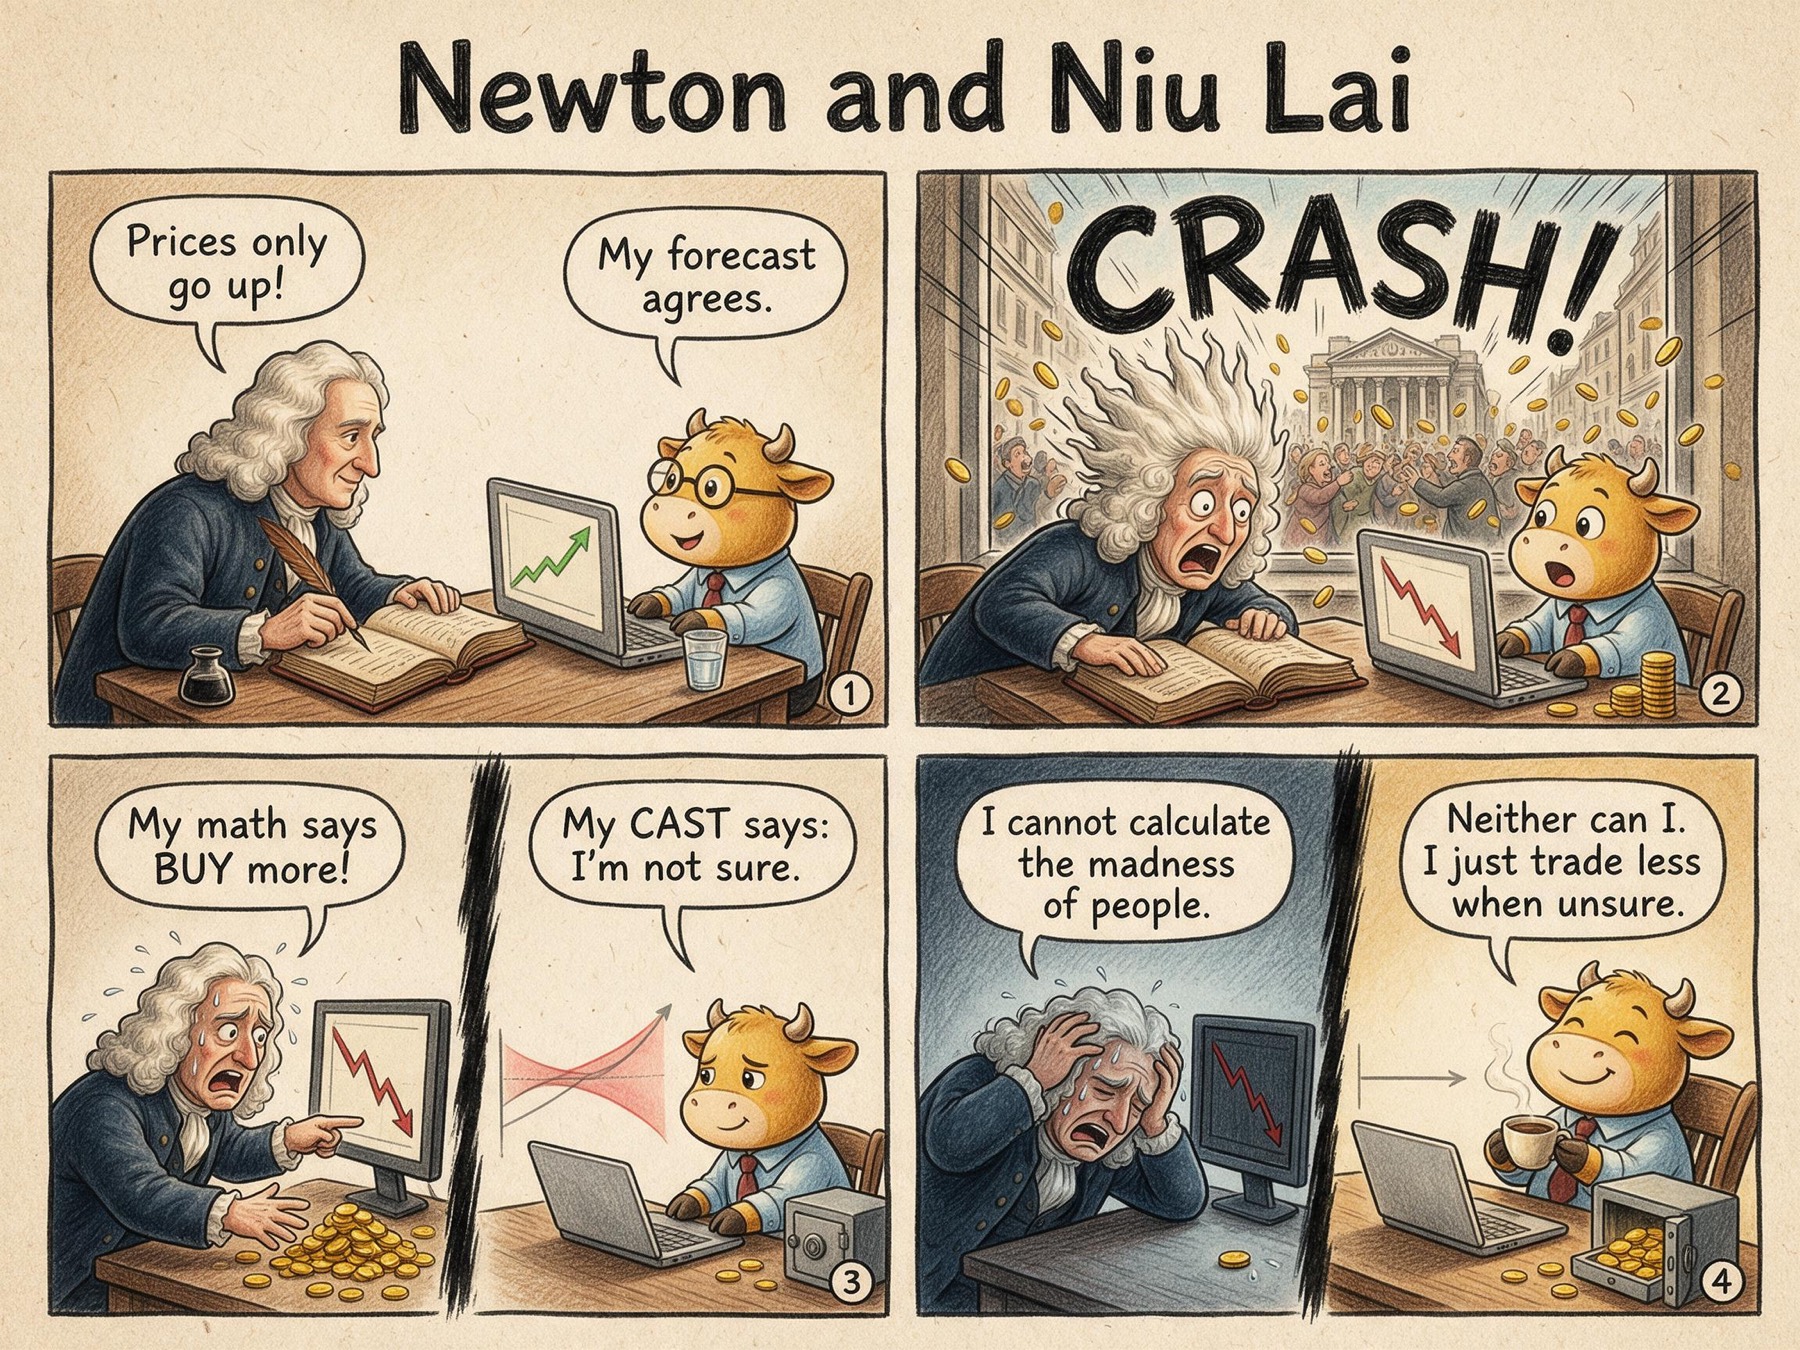
Four-panel comic, Newton and Niu Lai. 1: both forecast rising prices. 2: the market crashes. 3: Newton says 'My math says BUY more!' while Niu Lai, seeing a widening red uncertainty band, says 'My CAST says: I'm not sure' and moves his coins into a safe. 4: Newton, wiped out, says 'I cannot calculate the madness of people'; Niu Lai, sipping coffee, replies 'Neither can I. I just trade less when unsure.'

Abstract

Managing drawdown, the peak-to-trough decline in an investment portfolio’s value, is a precondition for long-term survival in practical investment management. However, mainstream stock forecasting methods predominantly optimize returns or Sharpe ratios under the independent and identically distributed (i.i.d.) assumption. Real markets do not follow this assumption, triggering catastrophic drawdowns.

We propose a cross-asset state-space trading system (CAST), consisting of two components: The predictor, Cross-Asset Collaborative Kalman Filter (CoKF), estimates each asset’s latent state online, coupling all assets through their correlations and adaptively fusing multiple integrated-random-walk orders. The controller, Model Predictive Control (MPC), converts the predictor’s forecast into trades, using forecast uncertainty as an explicit risk penalty that controls drawdown.

We evaluate CAST on four real-world stock markets over a 15-year test window and show that it consistently occupies the return–drawdown Pareto frontier, achieving strong risk-adjusted performance while maintaining substantially lower maximum drawdown than competitive baselines. A stress test across crisis periods further demonstrates robust behavior under market shocks and distribution shift. Because the predictor and controller interact only through the predicted price path, both are plug-and-play, making CAST a modular, interpretable trading system.

Poster

CAST poster for IEEE ICDM 2026 (DM911): WHY, HOW and RESULTS panels
IEEE ICDM 2026 poster (DM911).

Datasets

4real-world stock markets
30stocks per panel, daily close
20yrsof data, Jan 2005 – Apr 2025
15yrsout-of-sample test window
United States NASDAQ NASDAQ Composite constituents
China CSI 300 Large-cap A-shares
Japan TPX100 Tokyo Stock Exchange blue-chips
Cross-currency Global30 Five currency zones: USD, EUR, JPY, GBP, CNY

The 2008 crisis sits in the calibration segment; the test window brings two different ones — the 2020 COVID-19 liquidity shock and the 2022 rate-hike repricing. Parameters are calibrated once on pre-2010 data and never refitted. Each panel is one parquet file of prices plus a JSON ticker list; Global30 prices are normalised to their first-day value before backtesting, the other three panels use raw prices.


Method

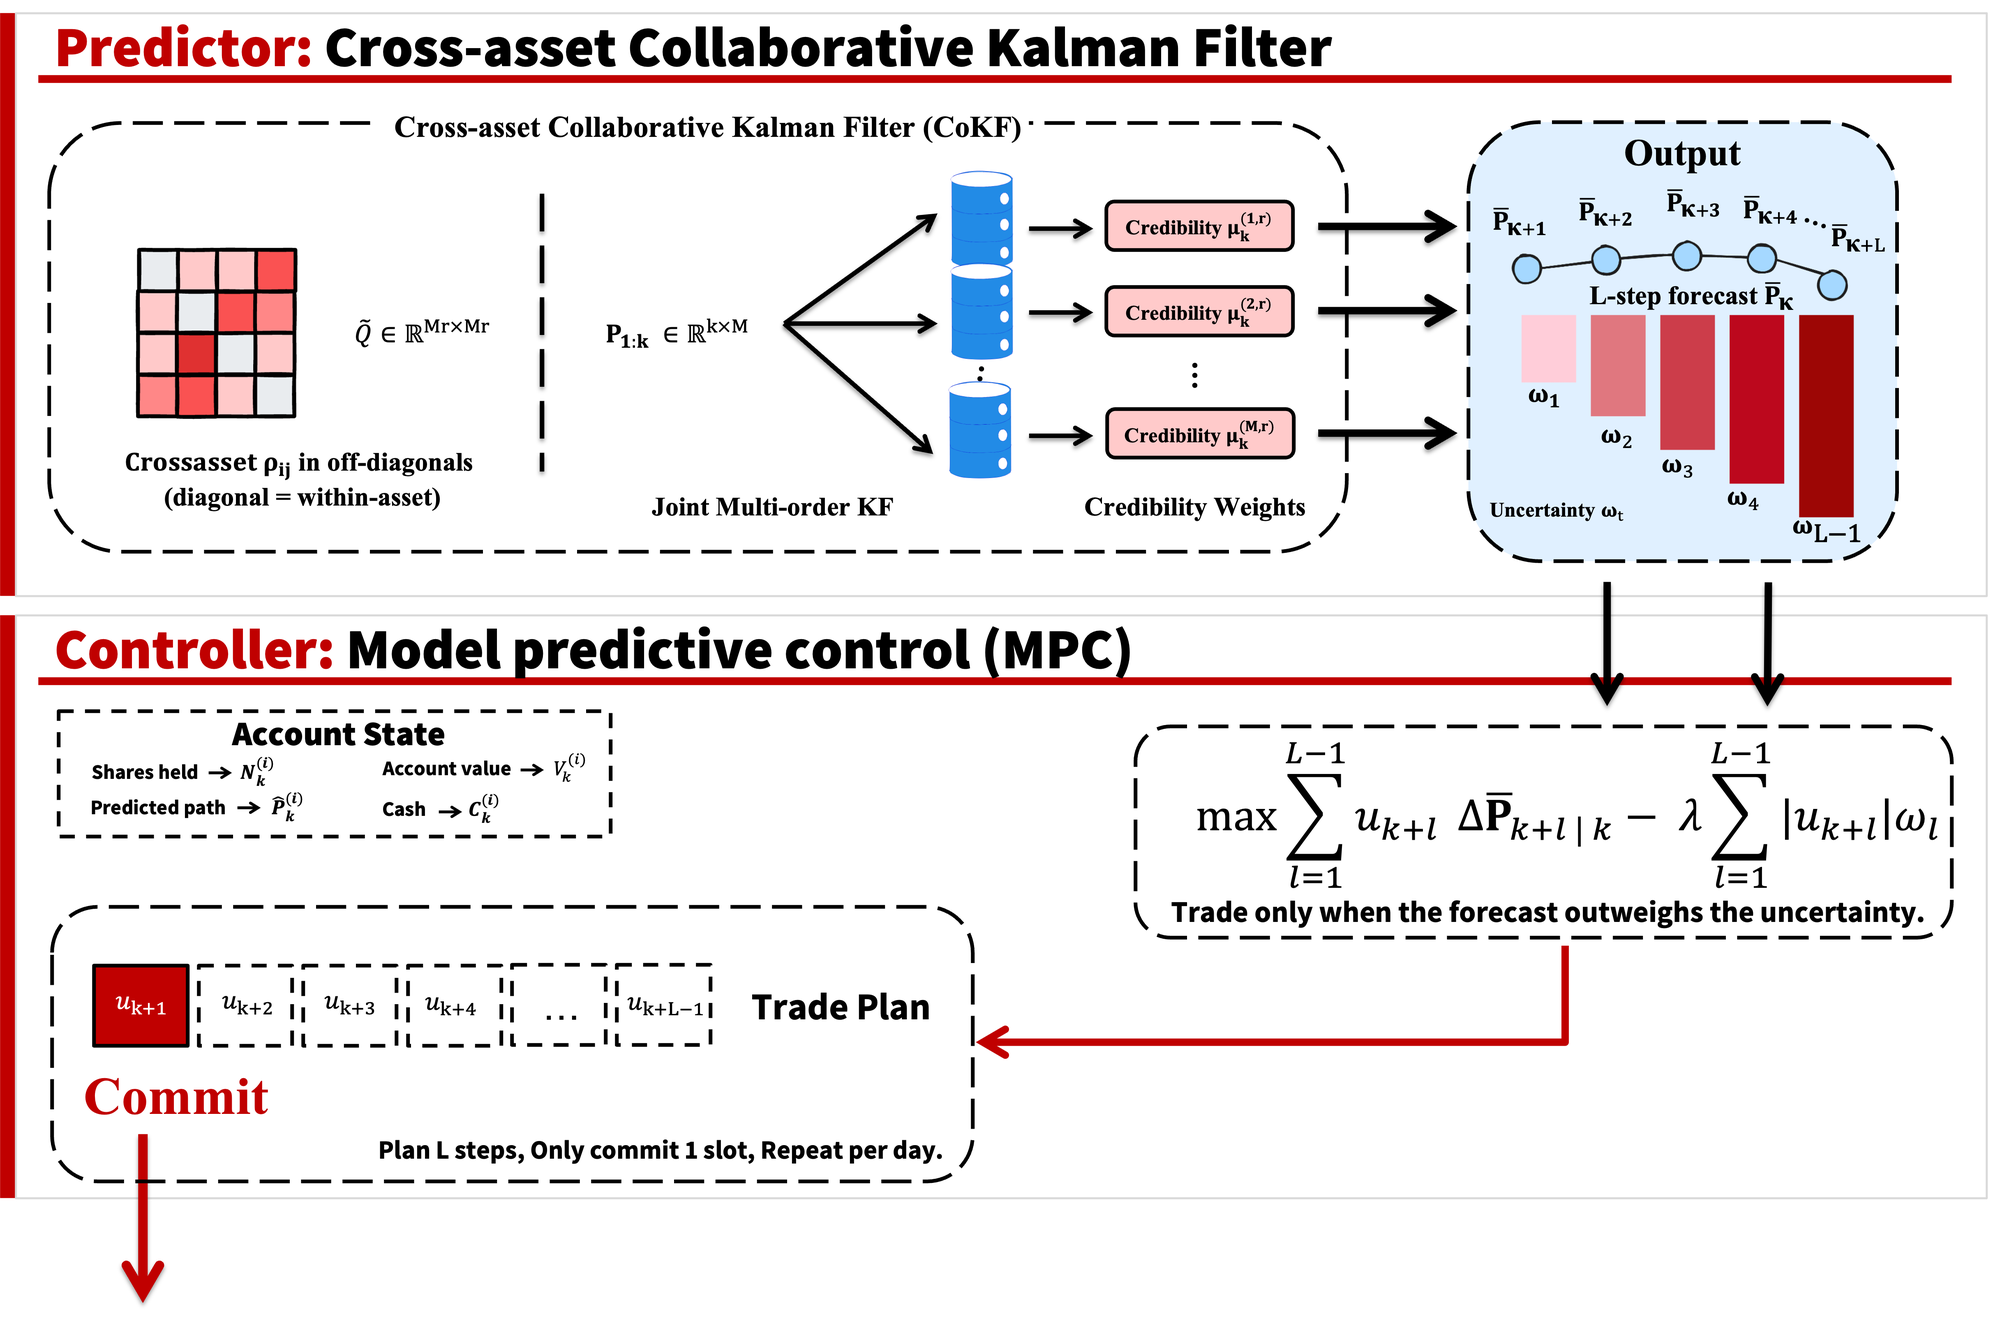
CAST architecture: the CoKF predictor produces an L-step forecast and its uncertainty; the MPC controller trades only when the forecast outweighs the uncertainty
Overall framework. The predictor (CoKF) emits an L-step price forecast P̄k+l|k together with its forecast uncertainty ωl; the controller (MPC) plans the whole trade sequence, penalises every trade by λ·|u|·ωl, and commits only uk+1 before re-planning at the next close. The two modules share nothing but this forecast–uncertainty pair, so either is plug-and-play.

PredictorCoKF

Each close price is treated as a noisy reading of a hidden intrinsic value, tracked by a Kalman filter. It updates recursively from the latest price — no retraining, constant work per step — and its error covariance reports how uncertain it is.

Multi-order. Integrated-random-walk filters of order r = 1, 2, 3 (constant, linear and parabolic local paths) run in parallel. Each is scored by its recent L-step error, and a closed-form credibility weight μ shifts trust between orders every day, so the model adapts to regime shifts online.

Cross-asset. All assets share one joint filter coupled through the process-noise covariance Q̃, whose off-diagonals are ρijσv(i)σv(j): shared market shocks move the latent dynamics, not idiosyncratic measurements. With ρ = I it reduces exactly to independent per-asset filters.

ControllerMPC

One risk-isolated controller per asset. On a receding horizon of L = 7 trading days it plans the trade sequence uk+1, …, uk+L−1 maximising predicted horizon profit net of the uncertainty penalty, under two constraints: the planned trades must sum to −uk (unwinding today’s trade by the horizon end), and no single trade may exceed half the account value (β = 0.5). Only the first trade is executed; the plan is rebuilt at the next close with fresh prices.

Uncertainty as risk. The penalty weight ωl is the l-step forecast standard deviation, built from the same credibility weights that produced the forecast. When uncertainty rises, the penalty grows and positions shrink — the system de-risks automatically as a crisis sets in.

With slack variables for |u| the problem is a linear program, solved in sub-millisecond time.


Results

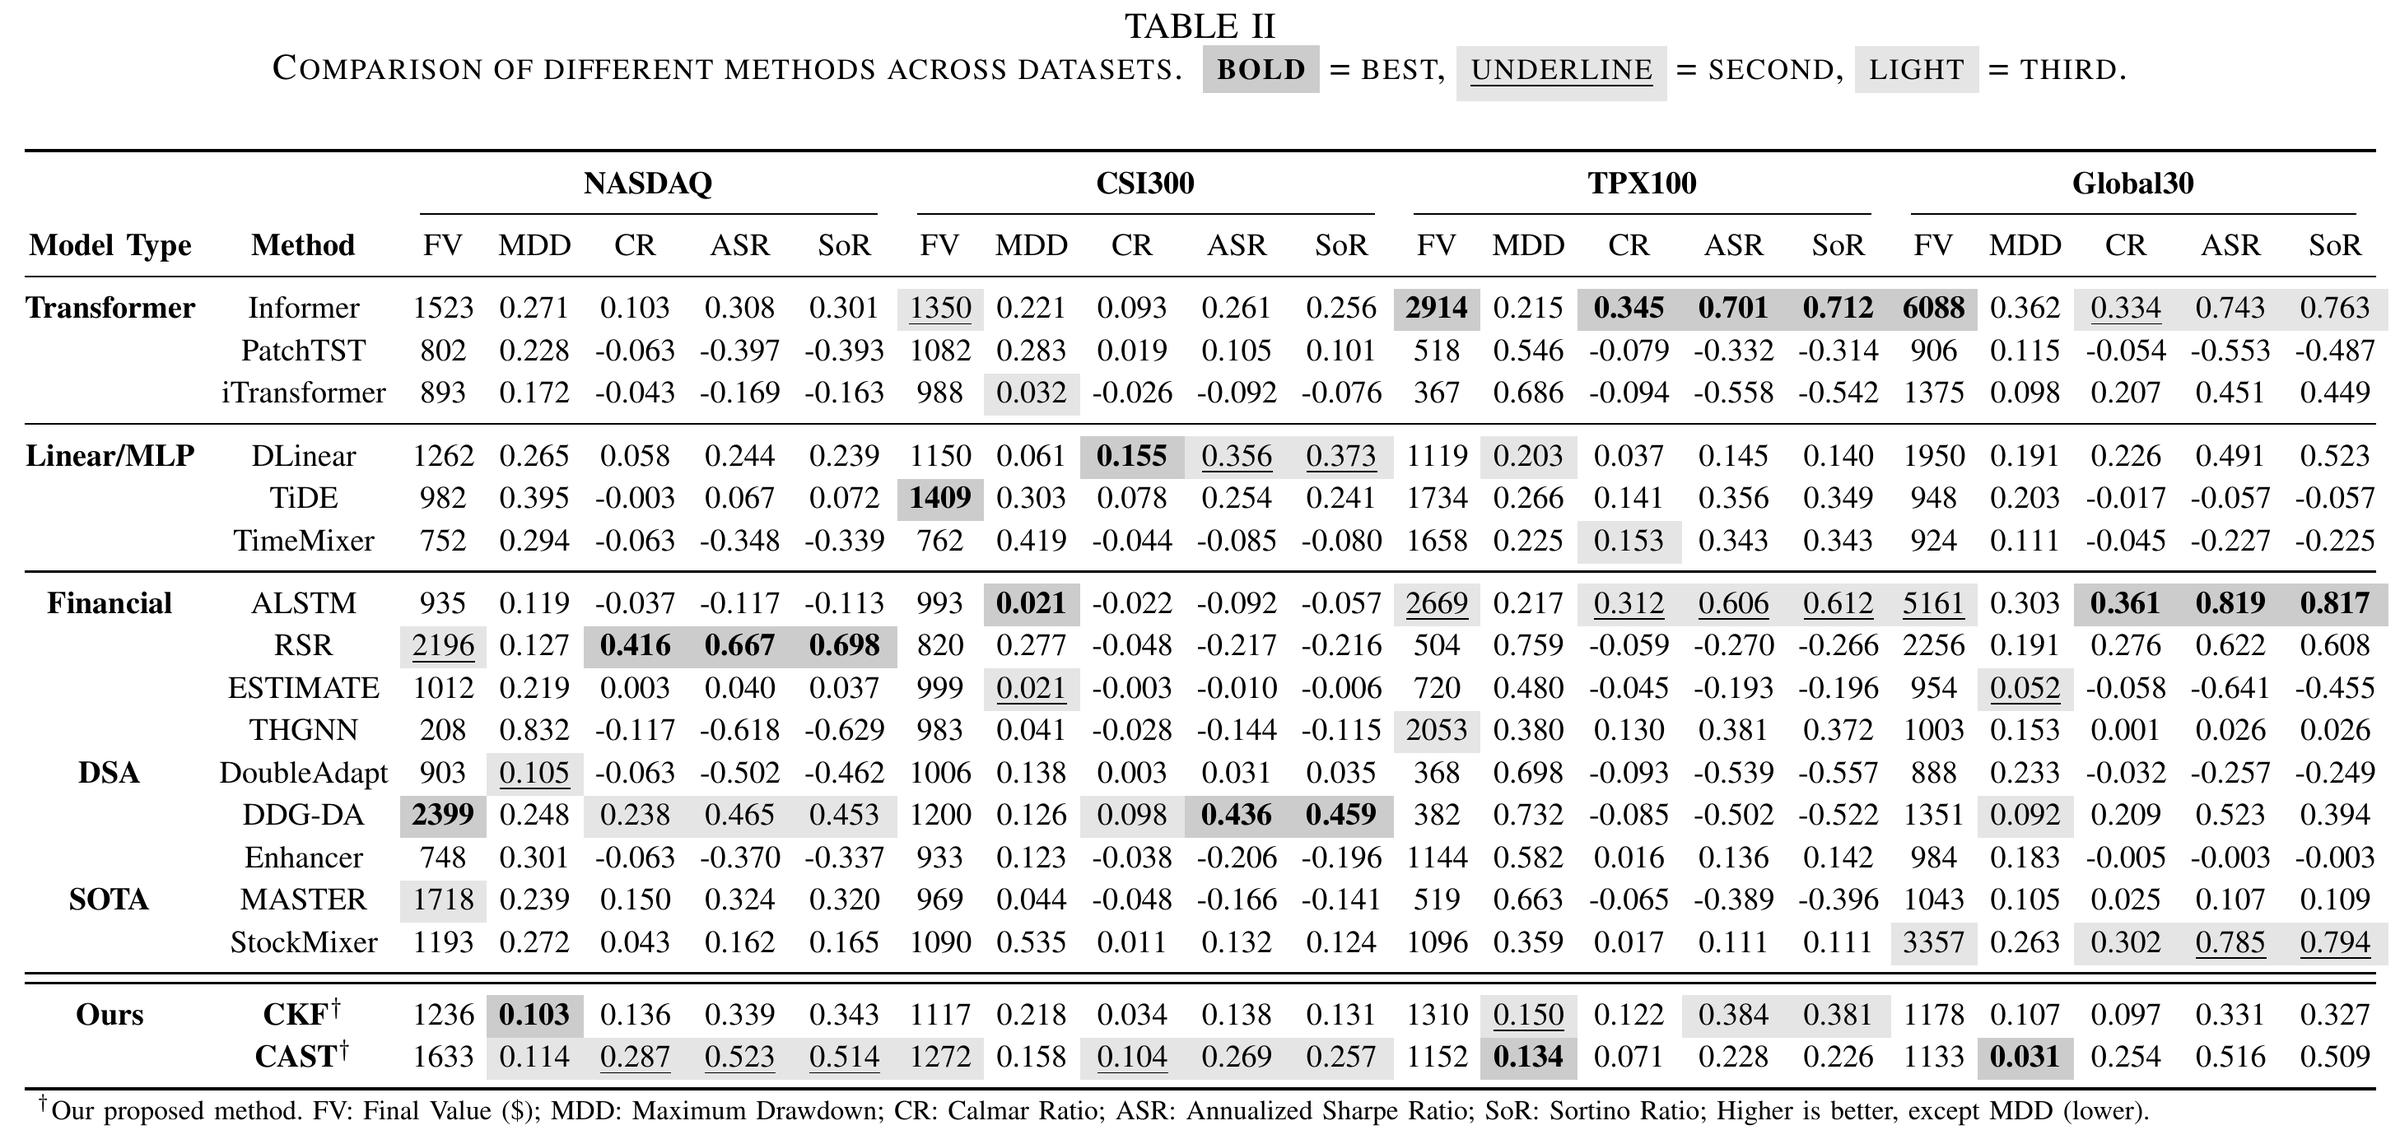
Table II: comparison of CKF and CAST with 15 baselines on NASDAQ, CSI300, TPX100 and Global30
Main results (Table II). CKF and CAST against 15 baselines — Transformer, Linear/MLP, financial, distribution-shift-adaptation and SOTA stock forecasters — on all four markets. FV: final value from $1000; MDD: maximum drawdown (lower is better); CR, ASR, SoR: Calmar, annualized Sharpe and Sortino ratios (higher is better).
Supplementary · Table III

Maximum drawdown during two crises

COVID-19 crash (2020)Rate-hike crisis (2022)
MethodNASDAQCSI300TPX100Global30NASDAQCSI300TPX100Global30
Market0.3400.1590.2500.2580.2520.1720.1500.336
BLSW0.2650.0430.0450.1480.0610.0710.0390.066
CSM0.1270.0420.0150.0310.1860.0650.0570.166
AlphaStock0.0520.0320.0320.0330.0700.0590.0360.064
MetaTrader0.1620.0400.0410.0480.0960.0570.0670.076
FreQuant0.1860.0450.0300.0940.1160.0630.0670.090
CKF0.0450.0570.0550.0090.0260.0860.0330.018
CAST0.0710.0350.0090.0100.1030.0770.0160.017
Crisis stress test. Bold red marks the lowest (best) MDD and underline the second lowest. Buy-and-hold loses 15–34% of capital across these crises; CKF or CAST posts the lowest drawdown in 6 of the 8 columns. Baselines: traditional strategies (Market, BLSW, CSM) and RL-based portfolio methods (AlphaStock, MetaTrader, FreQuant).

Citation

@misc{peng2026cast,
  title        = {{CAST}: A Cross-Asset State-Space Trading System
                  for Drawdown Control in Stock Markets},
  author       = {Peng, Yu and Khushi, Matloob and Poon, Josiah},
  year         = {2026},
  eprint       = {2609.14205},
  archivePrefix= {arXiv},
  primaryClass = {cs.CE},
  doi          = {10.48550/arXiv.2609.14205},
  url          = {https://arxiv.org/abs/2609.14205},
  note         = {Accepted at IEEE International Conference on Data Mining (ICDM 2026)}
}